
The normal distribution, also known as the Gaussian distribution or bell curve, is a probability distribution that is symmetric about the mean. It describes how the values of a variable are distributed. Here are its key characteristics:
- Symmetry: The distribution is symmetric around the mean, meaning the left and right sides of the curve are mirror images.
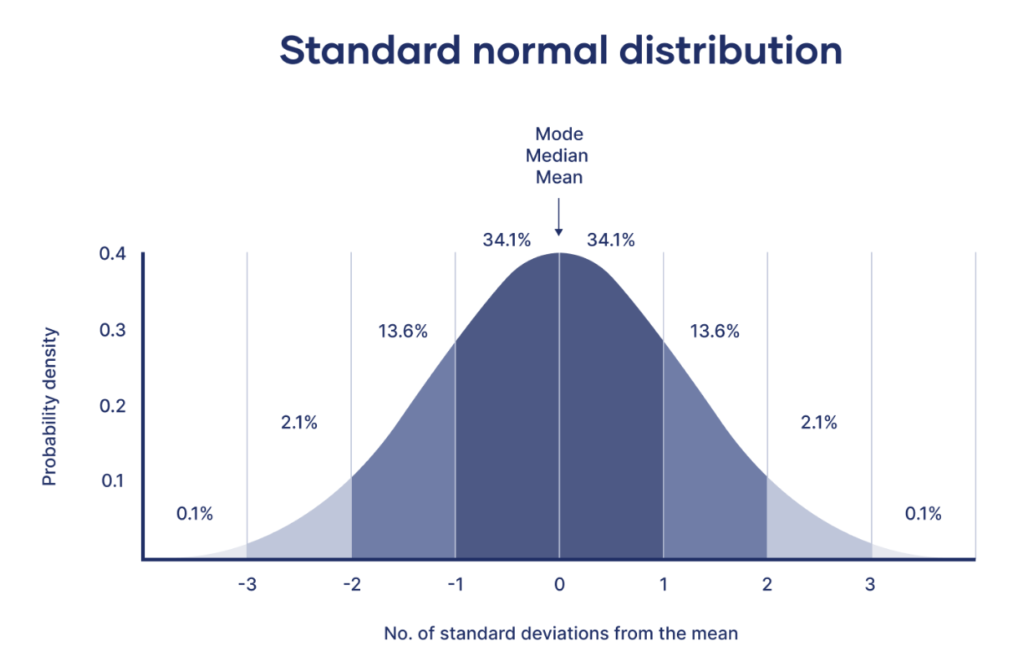
- Mean, Median, Mode: All are equal and located at the centre of the distribution.
- Standard Deviation: Determines the width of the curve.
- 68% of data falls within one standard deviation from the mean,
- 95% within two, and
- 99.7% within three (68-95-99.7 rule).
- Asymptotic: The tails of the distribution approach the horizontal axis but never touch it.
Properties
- Bell Shape: The normal distribution has a distinct bell-shaped curve.
- Unimodal: It has a single peak at the mean.
- Continuous: The probability density function is continuous and smooth.
Importance
- Central Limit Theorem: States that the sum of a large number of independent, identically distributed variables will be approximately normally distributed.
- Statistical Inference: Many statistical methods assume normality, especially those related to hypothesis testing and confidence intervals.
Applications
- Natural Phenomena: Heights, blood pressure, measurement errors, etc., often follow a normal distribution.
- Business and Economics: Stock returns, consumer behaviour metrics, etc.
- Quality Control: In manufacturing, the normal distribution helps in controlling and improving processes.
Understanding the normal distribution is fundamental for many fields such as statistics, economics, engineering, and natural sciences due to its prevalence and useful properties in data analysis.